
Whole plasmid sequencing can help you uncover sample purity issues that remain invisible with traditional Sanger sequencing methods. We return read length histograms as part of your plasmid sequencing data package to show the distribution of lengths of the raw sequencing reads from your sample. These are useful for characterization and troubleshooting of unexpected issues such as insertions, deletions, recombinations, or concatemers. This post shows how different issues show up in your read length histogram.
The histogram displays the lengths of the raw reads produced by your sample, with read length (bp) on the x-axis and thousands of bases of data collected (kb) at that length on the y-axis. The histogram is therefore weighted by the amount of sequencing data produced by different sizes of molecules; for example, two DNA fragments of different lengths that produce the same number of reads will produce different amounts of total data.
The x-axis is automatically scaled to the maximum read length produced by your sample. Before sequencing your plasmids, we linearize them so that we get mostly full-length sequence reads. As a result, the lengths of the raw sequencing reads reflect the lengths of the molecular species in your sample.
Additionally, the histogram color key indicates what fraction of the raw data maps to the consensus sequence. Dark blue indicates that the raw reads align to the consensus/assembly sequence, orange maps to the E. coli genome, and light blue is unmapped, indicating either sequencing noise, a genome other than E. coli, or a lower abundance plasmid species that doesn't generate a consensus.
Ideally, your target plasmid will be the only species in the sample, and we will see one dominant peak in the read length histogram:
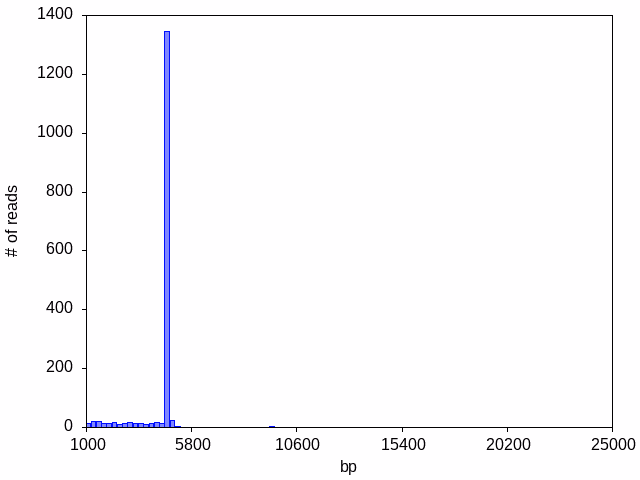
A dominant peak (~4,800 bp in this case) typically suggests a clean prep with a single plasmid. Because the histogram only shows length, even a single apparent peak could contain multiple plasmids of the same size, or multiple plasmids of similar lengths that happen to fall into the same histogram bin. Sequences that are very similar are assumed by the analysis pipeline to be variations of a single species and the software will attempt to make a single consensus, flagging positions where there is low confidence; if the sequences are very distinct, it will only produce a consensus for the most abundant species. The other tools and files of the plasmid data package allow you to explore the consensus sequence.
Once in a while, you might see your histogram for a single plasmid (~2500 bp in this case) straddle a bin boundary and artifactually create an appearance of two separate peaks:
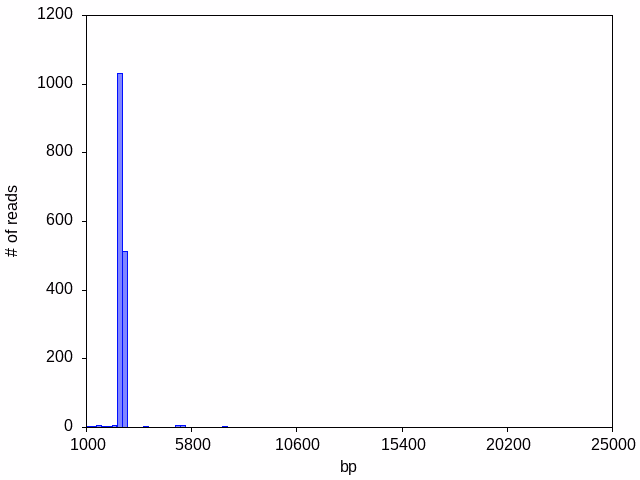
This is a common artifact of the noise inherent in raw reads, which is corrected in the assembly of the consensus plasmid sequence.
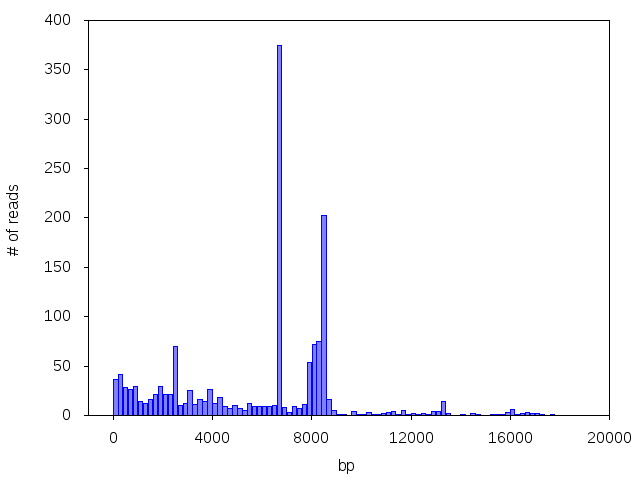
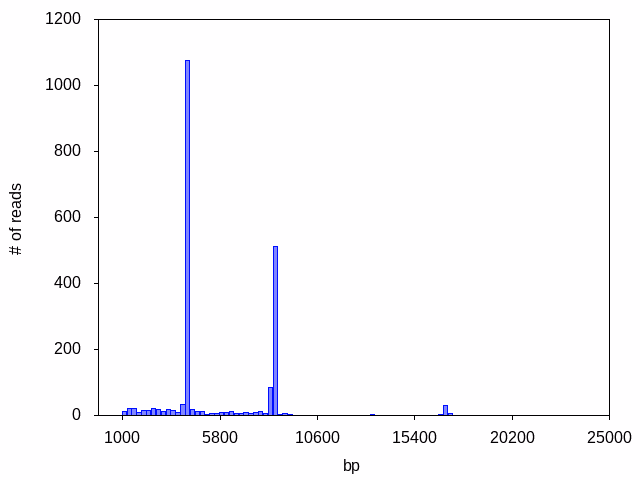
More often than you would expect, we see multiple peaks corresponding to multiple plasmids, or a peak of a different size than the customer expected:
Uh oh! Good thing you did whole plasmid sequencing, Sanger sequencing might not have shown you all these plasmid species!
Spotting Concatemers
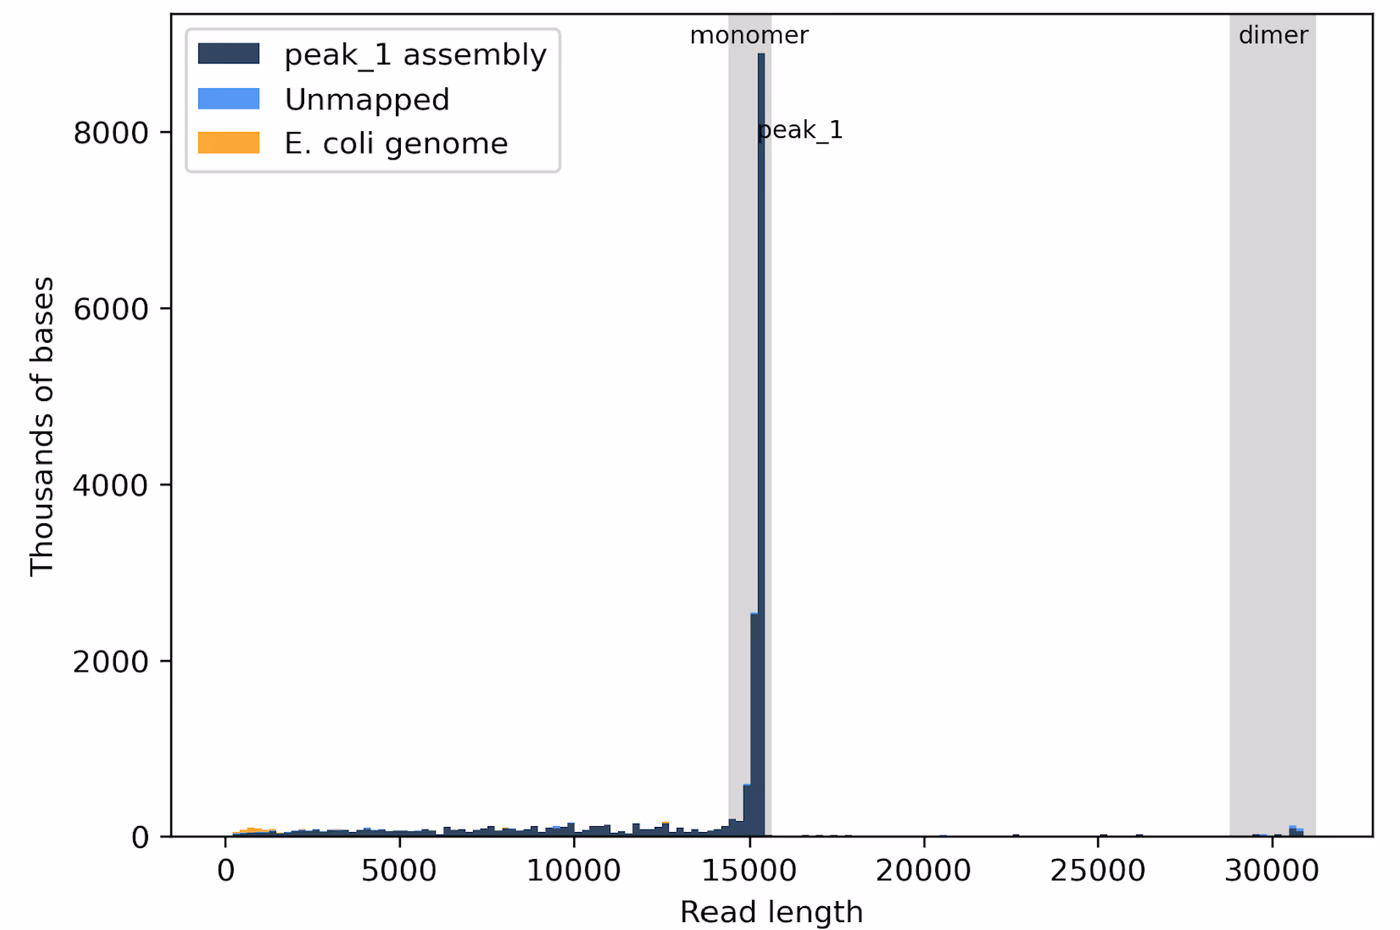
This histogram shows that most of the data is produced by the monomeric form of the plasmid at 15 kb, but there is also a small amount of data from the dimer at 30 kb.
Plasmids can naturally concatemerize through homologous recombination, especially those that have large inserts or long repeats, or are present at high copy number (see this great post from Addgene for more details on how concatemers form and how to diagnose them). They are often formed in vivo during growth in a RecA+ strain (such as NEB Turbo cells), but these different plasmid species are invisible to commonly used tools for plasmid verification — digestion cuts multimeric plasmids into monomeric pieces, so they are indistinguishable on digestion gels, and Sanger sequencing only covers short sections of the plasmid so you can’t see the whole picture.
Long read sequencing captures the full length of the plasmid, so you can easily catch multimerization. We see concatemers like this all the time -- they are not a sequencing artifact. They’ll show up as peaks in your read length histogram, as well as extra bands in your virtual gel.
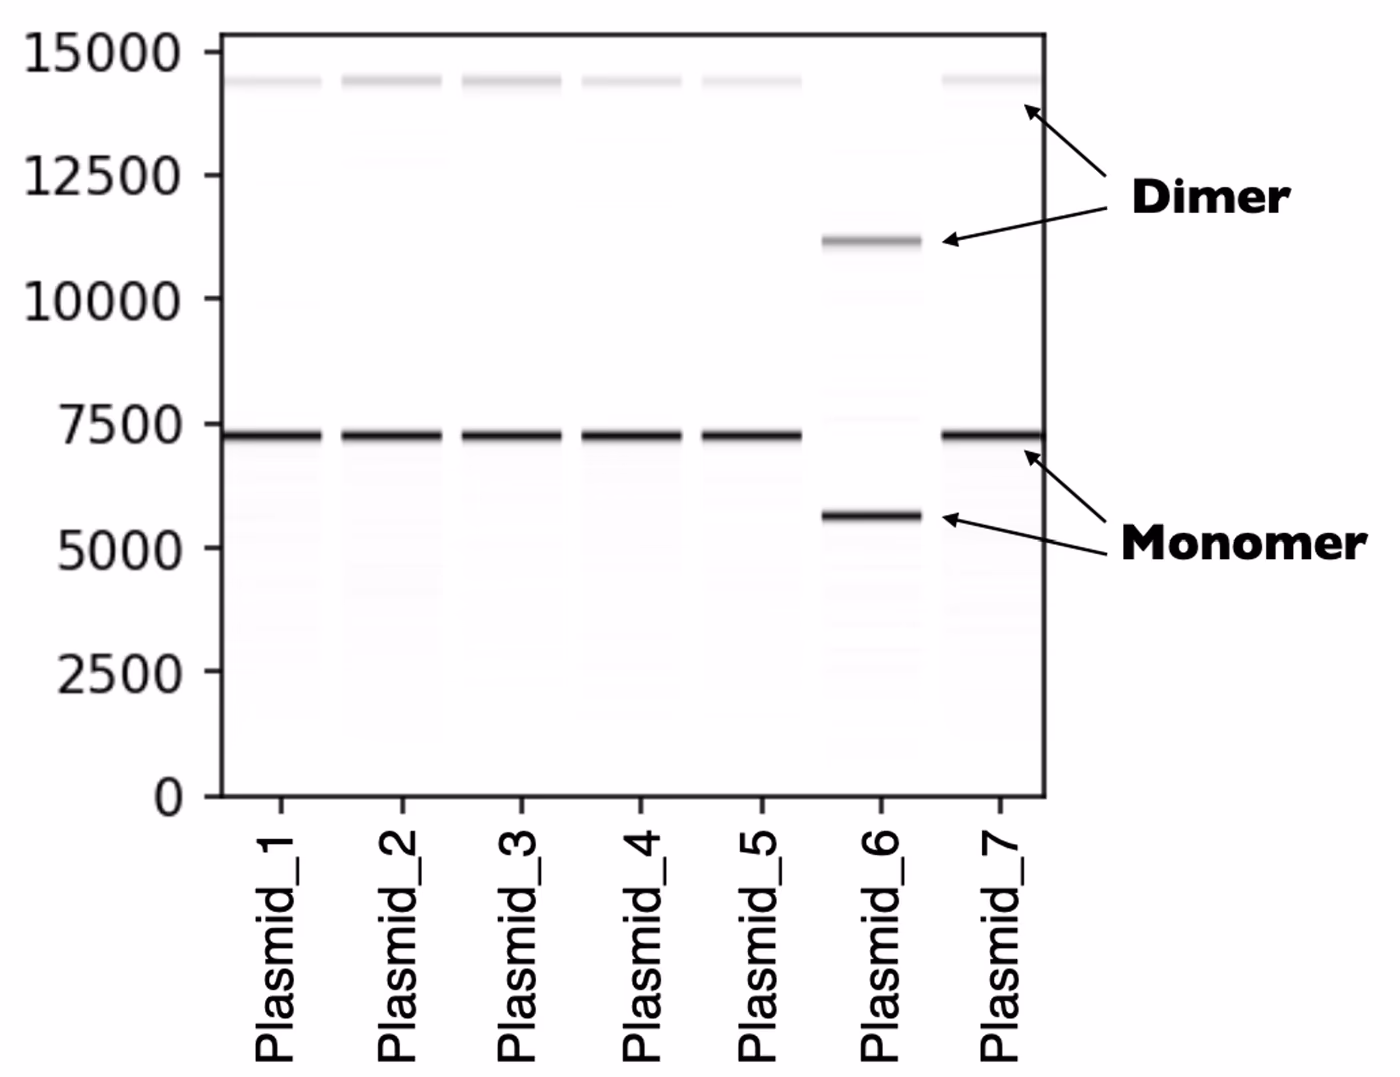
Each sample shown in this virtual gel displays two distinct bands, one for the monomer and one for the dimer.
Please note that concatemer forms such as dimers, trimers, etc. are not considered different molecular species by the pipeline, so you will only receive the monomer consensus sequence by default.
Unexpected products or degraded samples
This sample contains 3 unique plasmid species, only 2 of which (~8,600 bp and ~4,200bp bp -- corresponding to the target plasmid and the empty vector, respectively) yielded enough coverage to produce a consensus.
If your sample contains a mixture, we will return only a single consensus for the molecular species that produces the largest amount of total sequencing data. If you’d like us to try generating a consensus for an alternate peak instead, you can email us at support@plasmidsaurus.com to provide your expected reference sequence and we will evaluate your request.
Occasionally we see a sample with a dominant peak in addition to an abundance of degraded DNA (genomic and/or plasmid). In some cases the dominant peak may still produce a consensus, if read coverage and accuracy are sufficient:

This sample produced a consensus for the ~14,000 bp peak, with the degraded plasmid fragments contributing to its coverage.
Sometimes we see a decent number of reads for the sample but there is NO dominant peak, indicating an abundance of degraded DNA (genomic and/or plasmid) from a poor plasmid prep, or that the strain contains no plasmids:
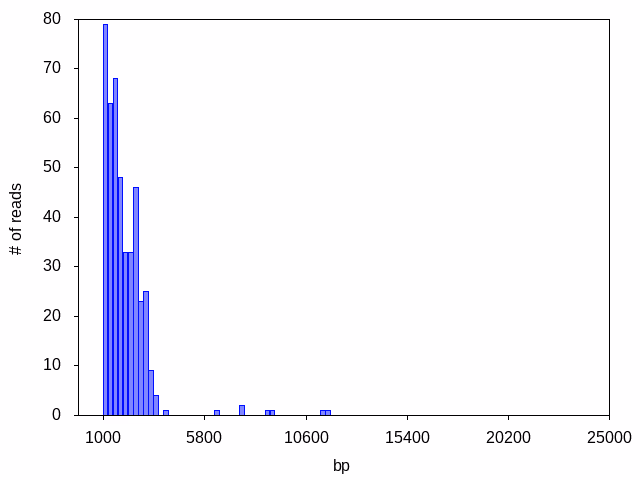
No dominant peak was observed in this sample, despite high read count. No consensus was generated.
Often, the read count is too low to distinguish any peaks or to generate any consensus:
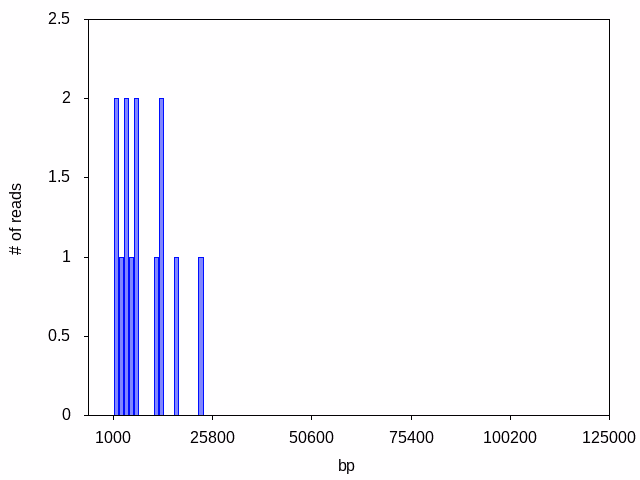
If read count is too low, usually it is because samples are not prepared at the required concentration. Check out sample prep instructions for best practices for getting high quality sequencing results.
Beyond finding mismatches, insertions, and deletions, our data package gives you important insight into what’s going on with your plasmids and keeps your science moving forward.