
From terminal tears to discovery cheers: Our automated RNA-Seq analysis platform flips the script, transforming a tedious chore into an enjoyable analysis experience.
The arrival of Next Generation Sequencing (NGS) has ushered in the era of big biological data — and big computational demand. We can now collect more sequencing in a single day than our scientific predecessors gathered in their entire careers. But while this wealth of information promises to revolutionize how we understand biological systems, it also presents a new challenge: making sense of such massive amounts of data.
The reality is that mastering both deep biological domain expertise and computational bioinformatics is a tall order. Because it’s so difficult to be an expert in both, many successful large-scale transcriptomics projects rely on a close-knit collaboration between bench scientists and bioinformaticians. Unfortunately, bioinformaticians are often in short supply. Even though we can now collect massive amounts of data with ease, a lack of accessible computational pipelines and resources remains a major bottleneck, preventing researchers from discovering the critical biological insights hidden within their samples.
For many, the prospect of wrestling with code is enough to put a transcriptomics study on the back burner indefinitely. If this sounds familiar to you, we have good news! Plasmidsaurus has developed an automated bioinformatics pipeline that handles your RNA-Seq data for you, so you can skip the command-line, and get straight to analysis.
Our automated pipeline
Our team of bioinformaticians have crafted an industry-leading pipeline for RNA-Seq data analysis. As soon as your results come off of our sequencers, they are processed with a rigorous set of QC steps to ensure that ONLY the highest quality data is presented for analysis, and then plotted in intuitive, interactive figures.
These steps include:
- Filtering reads that don’t meet the minimum quality score and trimming off the low quality tails from otherwise good reads
- Aligning reads to the reference genome
- Deduplicating reads using unique molecular identifiers
- Calculating QC quality metrics to check alignment accuracy
- Calculating read counts for each gene
- Performing differential gene expression analysis
(If you want to know about the workflow in more depth, see our RNA-Seq Technical Documentation. There, we detail every package used for analysis, because we know that transparency is critical for publishing trustworthy, reproducible results.)
Interactive results
At Plasmidsaurus, it is our mission to remove all barriers slowing down science, and that includes data analysis and insight generation. This is why we built interactive, on-platform plots that are ready to go the second you log in. We take care of plotting so you can focus on what actually matters: evaluating your results and deciding on your next move.
Here’s what you’ll receive from your RNA-Seq order:
- Interactive, customizable, and downloadable plots
- Per-sample expression profiles (heatmaps and bar charts)
- Volcano and MA plots
- Functional enrichment plots
- Sample correlation matrix
- Downloadable tables and data:
- Gene count tables
- Enriched pathway tables
- A .bam file containing UMI-deduplicated reads aligned to the reference genome
- Quality control summary
- Raw reads
RNA-Seq Results Page highlights
When developing our RNA-Seq Results Page, our top priorities were ease of navigation and customizability so you can explore your data with maximally informative plots.
All of the plots are easily exported as a .png or .svg so you can use them directly in your next group meeting slide deck. Dazzle your colleagues with professional quality figures without spending hours making them yourself.
Want to create plots with your own style? No problem! You can also export all of the data, or specific selected subsets, so that you can use your own program to make plots as well.
Customizing your experience
When you first open your RNA-Seq results, a heatmap showing the top 30 genes with the most variability in expression is displayed. You can add genes by selecting them in the dropdown menu, or by clicking on them in the interactive plots on the page. You can also create and save groups of genes for easy repeat analysis.
Manage gene selections and differential gene expression comparisons at any time on the results page. Set them up after submission for instant pre-made plots when you log in to view your results for the first time, or build them on the fly as you analyze your data.
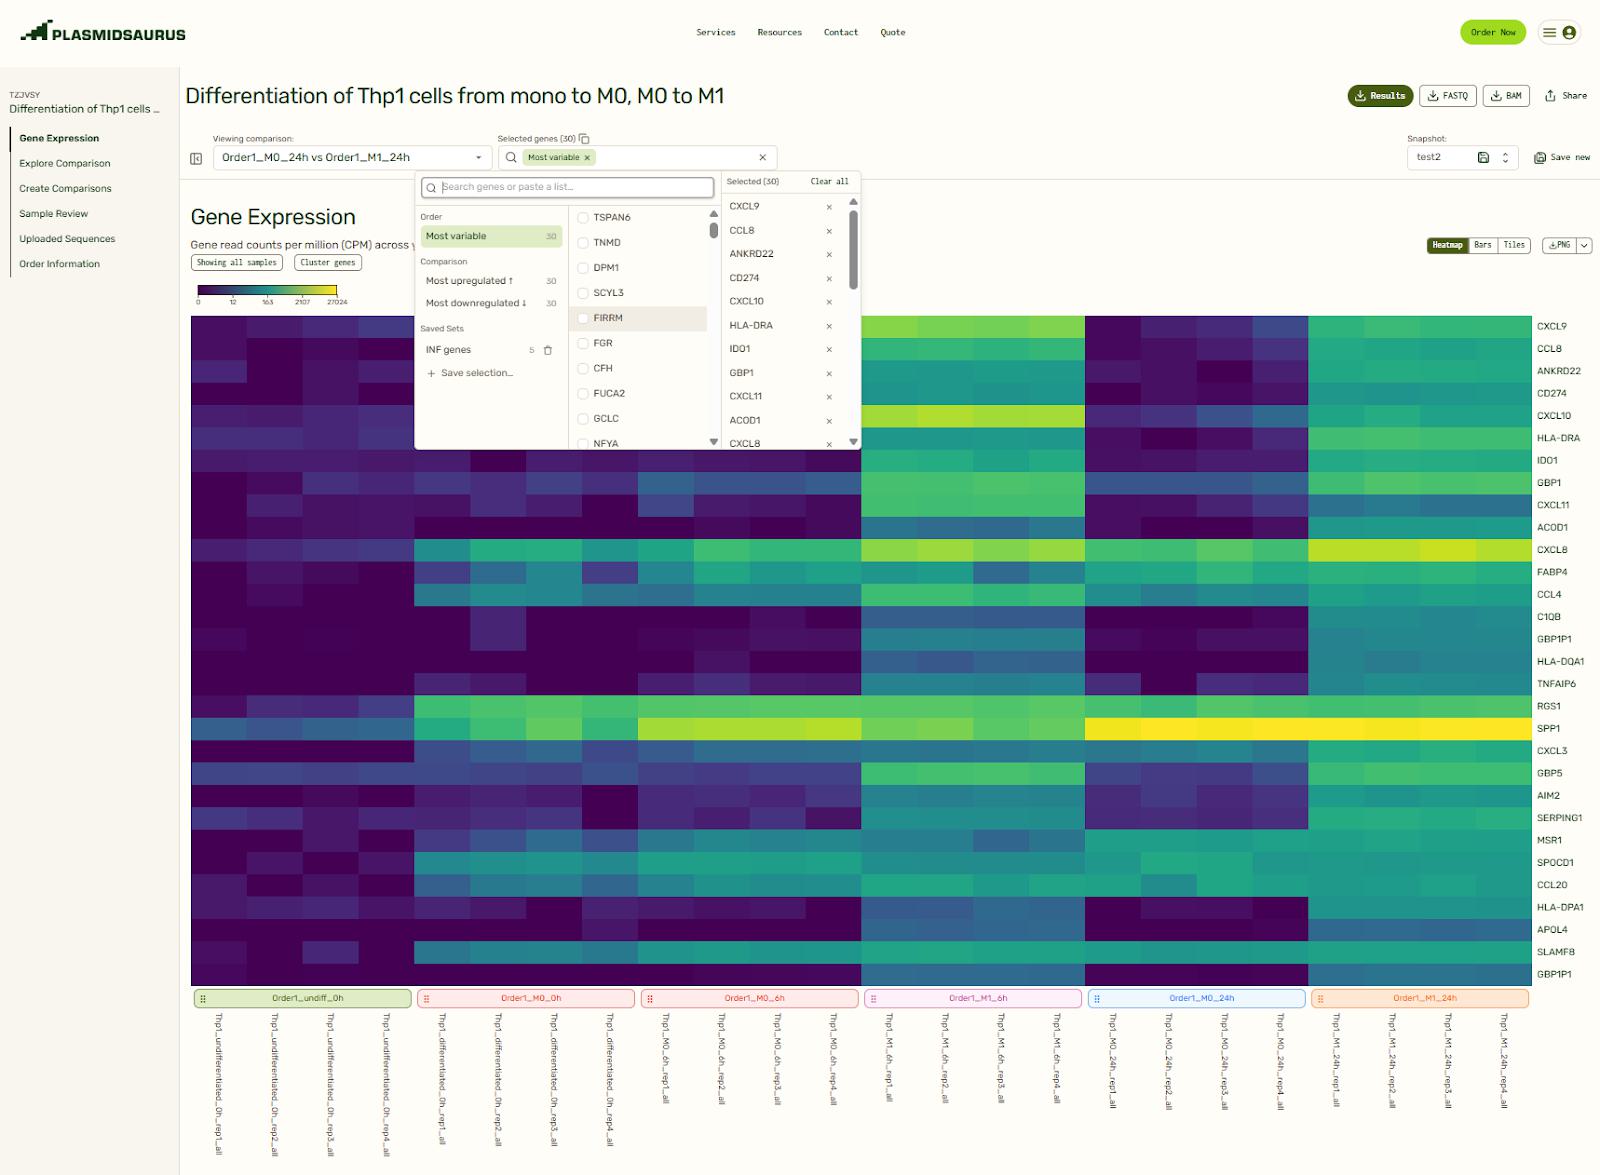
Gene expression: Per-sample expression profiles (heatmaps, bar charts, and tiles)
The heatmap, bar charts, and tiles give you a quick sense of your data before diving in deeper. Tailor which genes or samples are shown and define how they are grouped, normalize to a specific sample, and decide between a linear or log scale to create the exact visualization that you need. You can even reorganize the order of the heatmap or tiles by dragging them around. How cool is that?
Explore comparisons: Volcano/MA plots
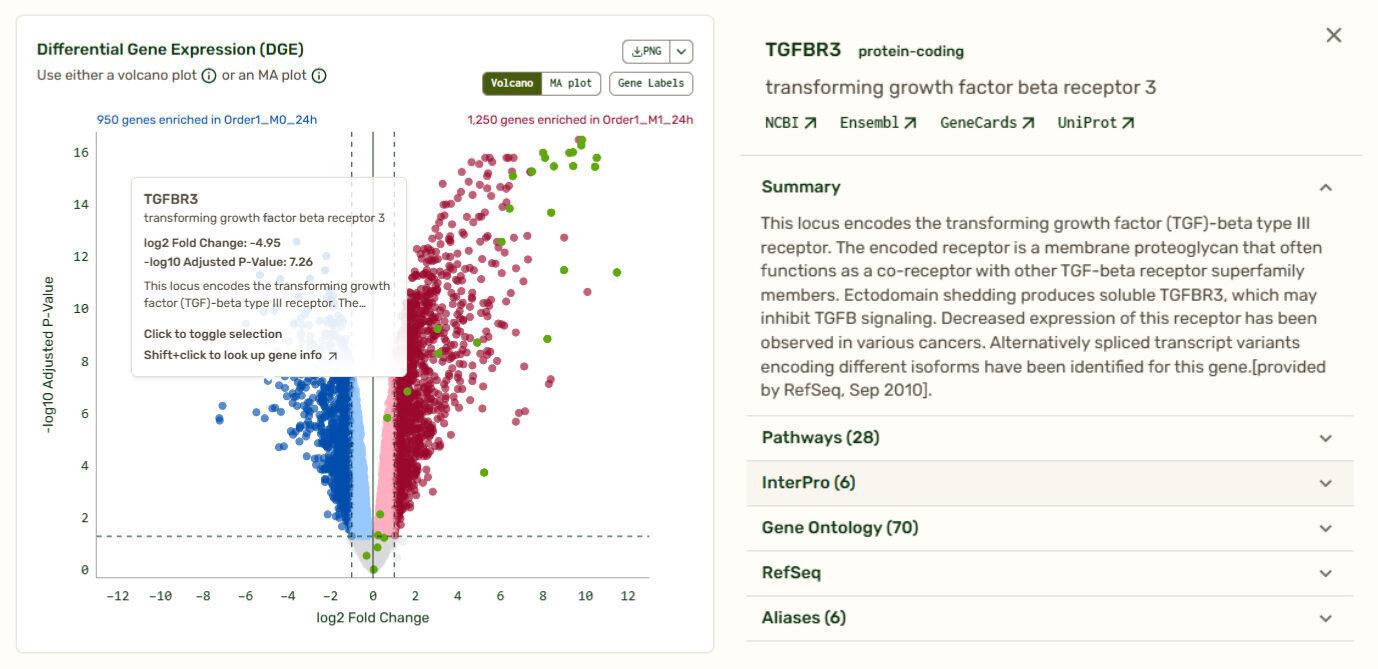
When it comes to visualizing comparative -omics data like differential gene expression, volcano and MA plots are industry standards. Volcano plots allow you to quickly identify changes in large datasets by plotting the significance and the fold change on the y and x axes, respectively. Set your own thresholds for fold change and adjusted P-value to define your own cutoffs. Transcripts that fall to the left of the negative log2 threshold are downregulated, and those that fall to the right of the positive log2 threshold are upregulated.
MA plots show the counts per million versus fold change to help you spot how systematic changes in expression relate to the relative abundance of the genes.
Clicking on any point on the plot brings up a summary of the gene, including links to its entries on databases such as NCBI, Ensemble, and Uniprot, a list of pathways it is involved in, InterPro classifications, and Gene Ontology information.
Explore comparisons: Functional enrichment plots
Next to the Volcano/MA plot, you will find a functional enrichment plot that shows the pathways identified with gene set enrichment analysis (GSEA). We’ve synced these tools so you can move from big-picture pathways to specific gene data instantly. As you hover over a pathway, the corresponding genes light up on the Volcano/MA plot, giving you immediate context on how that pathway is regulated relative to the global background.
Want to see more? Check out our Live Demo on our RNA-Seq Product Page!
Sequence (and analyze) Everything
The "bioinformatics bottleneck" is the silent killer of ambitious transcriptomics projects. For too long, researchers have had to choose between spending time mastering the command line or waiting months for a collaborator to find a free window in their schedule. At Plasmidsaurus, we believe that your time is better spent at the bench—or better yet, interpreting the biological "why" behind your results—than on troubleshooting alignment scripts. By automating the heavy computational lifting, we’ve turned what used to be a daunting technical hurdle into a seamless, interactive experience.
Our analysis pipeline doesn't just hand you a massive file and wish you luck. We provide the tools to visualize your data immediately, allowing you to:
- Spot trends instantly with customizable heatmaps and bar charts.
- Identify key players using interactive Volcano and MA plots.
- Uncover biological meaning through integrated functional enrichment analysis.
Whether you are a seasoned bioinformatician looking to reclaim your time or a bench scientist ready to dive into NGS for the first time, our platform is built to scale with your curiosity.
Ready to see what your samples are trying to tell you? Skip the computational headache and get straight to the science. Send us your samples today and see how our automated RNA-Seq pipeline turns a data bottleneck into a research springboard.