RNA-seq Technical Documentation
Technical details
Sequencing technology
Plasmidsaurus RNA-Seq utilizes Illumina sequencing and a 3’ end counting approach. We extract total RNA using a bead-based extraction approach from cells preserved in Zymo DNA/RNA Shield. Alternatively, you may send extracted total RNA, provided it is sent on dry ice (you should send at least 30 μl of sample volume, of at least 10 ng/μl, free of DNA and nucleases.)
We assess post-extraction (or received purified RNA) concentration using a fluorescence based plate reader assay and normalize sample concentrations before proceeding. Please note we do not assess an RNA Integrity Number (RIN) before proceeding, nor do we hold samples if the extracted RNA concentration is low. Making sure you send an adequate number of intact cells is key to getting optimal results.
For sequencing library preparation, we convert mRNA into complementary DNA (cDNA) via reverse transcription and second-strand synthesis, followed by tagmentation, library indexing, and amplification. Our approach uses 3’ end counting to capture differential gene expression. This method allows for extremely efficient and accurate counts of mRNA transcripts; for a little more info please check out this post.


Sample prep
For Lysed Cells
We ask you to submit ~100k cells in 50 μL Zymo DNA/RNA Shield. As transcriptional activity varies widely, this cell number is approximate guidance for transcriptionally active cells. If you’re unsure how active your cells are, we strongly recommend performing a bulk RNA extraction and quantitation to calibrate the typical expression levels of your specific cells, and use a cell count number that will provide at least 500ng of total bulk RNA.
You may also elect to send fewer cells (e.g. to accommodate culture in 96-well plates) but the number of deduplicated reads produced may be substantially lower. If your material availability is not limited, you can also double or triple the amount of volume sent, as backup in the event of any process issues that may be encountered, requiring a rerun. If you do this, please do not exceed 200 μl total volume, and strongly prioritize maintaining a high RNA concentration (vs providing additional volume), as we cannot use more than 50 μl per processing iteration (or 30 μl per iteration for purified RNA).
We aim to return 10M deduplicated reads from about 20M raw reads, as well as count tables, sequencing QC, and raw data. For more detailed sample prep information please check out our sample prep instructions.
For Purified RNA
If purifying RNA yourself, we support shipping of Total RNA both at ambient temperatures as well as on dry ice.
To submit RNA samples with ambient shipping via our dropbox network, you should stabilize them by adding SEQguard Dino Preserve. Mix 24 μL of RNA in IDTE buffer with 6 μL of SEQguard Dino Preserve to achieve a final concentration between 10-100 ng/μL.
If you’d prefer to ship your samples frozen on dry ice, you can skip the above preservation step and send us frozen RNA. Please make sure your concentration is between 10-100 ng/μL. Do not store or ship RNA in Zymo DNA/RNA Shield. If needed, store RNA at -80°C.
Purified RNA samples should be free of DNA and RNAse activity.
We aim to return 10M deduplicated reads from about 20M raw reads, as well as count tables, sequencing QC, and raw data. For more detailed sample prep information please check out our sample prep instructions.
Bioinformatics analysis
Our bioinformaticians have crafted industry-leading pipelines. Our major analysis goal is to build such robust workflows that even the pickiest of bioinformaticians wouldn’t want to squander their time by redoing any of the steps. Our RNA-seq analysis pipeline consists of the following steps:
- FastQ generation and demux with BCL Convert v4.3.6 and fqtk v0.3.1.
- Read-filtering using FastP v0.24.0: poly-X tail trimming, 3' quality-based tail trimming, a minimum Phred quality score of 15, and a minimum length requirement of 50 bp.
- Alignment to the appropriate reference genome using STAR aligner v2.7.* with non-canonical splice junction removal and output of unmapped reads.
- Coordinate sorting of BAM files using samtools v1.21.
- UMI based de-duplication: Removal of PCR and optical duplicates using UMICollapse v1.1.0.
- Mapping QC: Alignment quality metrics, strand specificity, and read distribution across genomic features using RustQC v0.2.1.
- Generation of comprehensive QC report using MultiQC v1.33.
- Gene-expression quantification using featureCounts (subread package v2.1.1) with strand-specific counting, multi-mapping read fractional assignment, exons and three prime UTR as the feature identifiers, and grouped by gene_id. Final gene counts were annotated with gene biotype and other metadata extracted from the reference GTF file.
- Sample-sample correlations for sample-sample heatmap and PCA were calculated on normalized counts (TMM, trimmed mean of M-values) using Pearson correlation.
- Differential expression using edgePython v0.2.5.
- Functional enrichment performed for human and mouse samples using gene set enrichment analysis with GSEApy v0.12 using the MSigDB Hallmark gene set.
Comparing across batches
What are batch effects?
Batch effects are technical variations that affect all samples within a batch similarly. Differences between batches can occur when samples are processed at different times, by different operators, or with different reagent lots. Batch effects can result in apparent expression differences that can obscure true biological signals and lead to misleading conclusions if not properly accounted for.
How can I avoid batch effects?
Strategic experimental design is the most effective way to avoid batch effects. Whenever possible, we recommend submitting related samples within a single order to ensure they are processed simultaneously, providing the highest level of data consistency and biological accuracy. To support this, our RNA-seq workflow is designed to process up to 96 samples per batch.
I have more than 96 samples, or would like to submit samples in different batches for another reason – how do I minimize batch effects?
For larger studies that have more than 96 samples, or for projects requiring multi-batch submissions for another reason, we recommend including several identical samples on every plate to serve as anchor controls.
You can implement anchor controls using one of two methods:
- Technical Replicates: Prepare a single control sample in bulk and distribute it across all plates.
- Biological Replicates: Include replicates of the exact same experimental condition on every plate.
Both approaches provide the necessary reference points to correct batch effects and ensure that your results reflect true biological differences rather than plate-specific variation.
Using Plasmidsaurus’ on-platform anchor-based batch correction
Plasmidsaurus offers an on-platform anchor-based batch correction feature (currently in beta) to make comparing experiments across plates or batches easier. We use an implementation of RUVseq, minimizing the variability between anchor samples across batches to normalize results.
Instructions for use
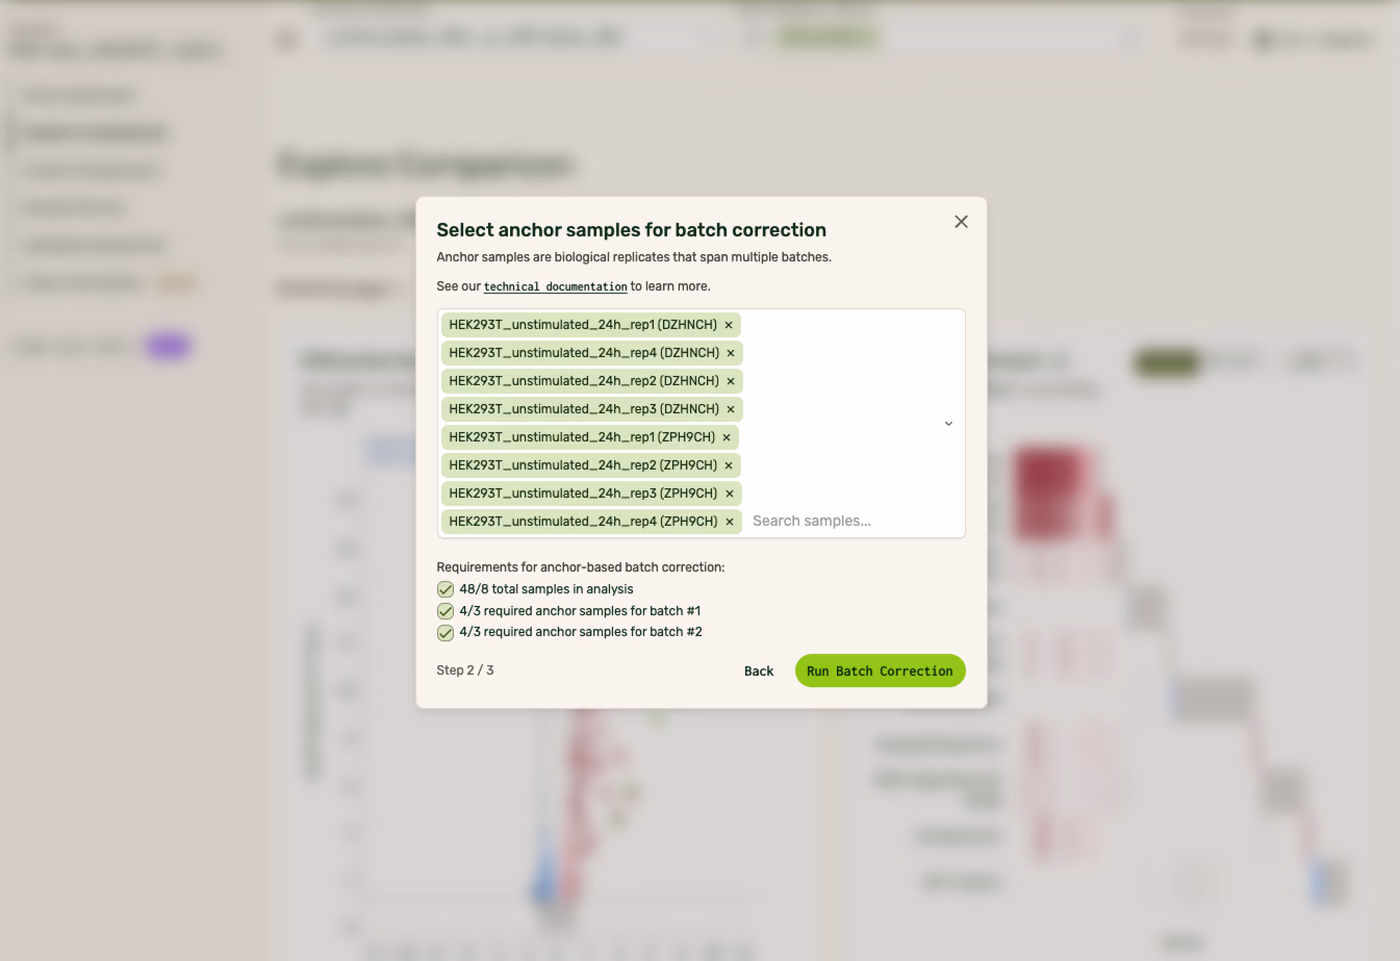
- Every batch must include ≥3 anchor samples that each have >5 million unique reads, and at least one other sample to be corrected.
- More anchor samples increases the accuracy of the correction.
- For effective batch correction, your anchor replicates should share the same biology as the groups in your DGE comparison (e.g. your control group). RUV estimates unwanted variation from the anchors — if their expression profile is too distant from the samples being compared, the correction factors it learns may not generalize well to your genes of interest.
- All orders must use the same species reference.
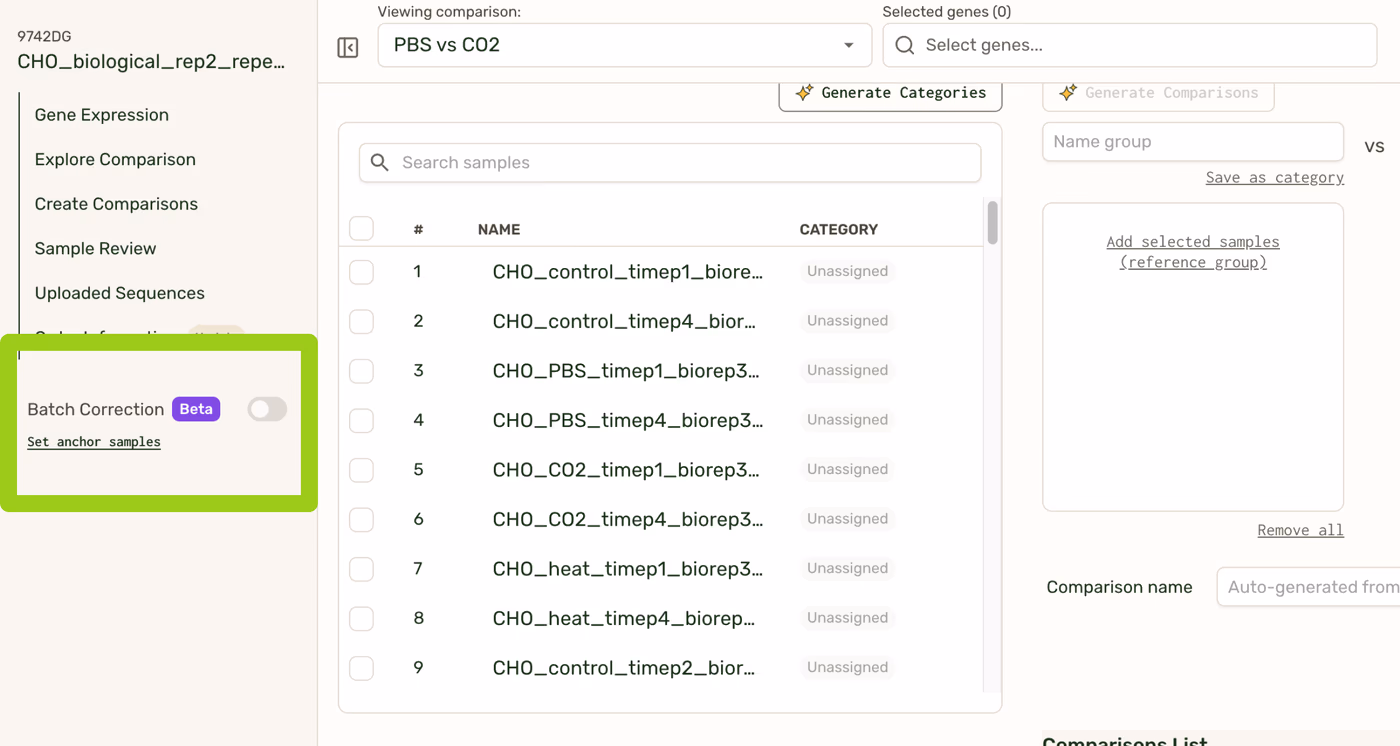
If you have >96 samples in a single order, perform a batch correction by navigating to the sidebar and clicking the button “Set anchor samples”. Once batch correction is run, it can be toggled on and off across your Results page from the sidebar.
If you have <96 samples in a single order, importing samples from a different order will prompt you to select anchor samples and run batch correction. One of the requirements of importing samples is to have a successful batch correction. Once batch correction is run, it can be toggled on and off across your Results page from the sidebar.
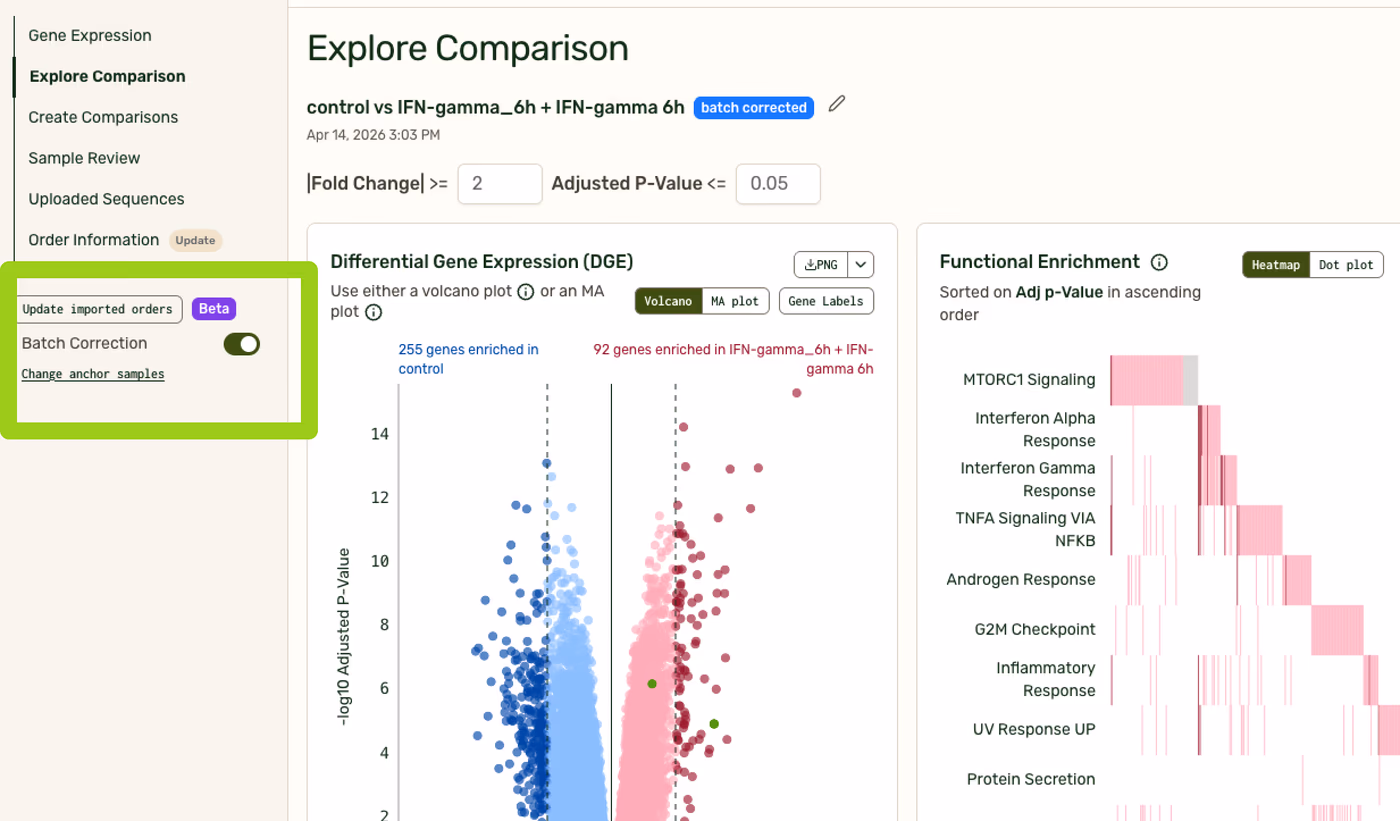
Specific plots that use the batch correction will be marked with a blue “Batch corrected” badge.
Outcomes of Plasmidsaurus’ anchor-based batch correction
To validate our batch-correction feature, we created technical replicates of HEK cells—treated with IFN-Beta, IFN-Gamma, or no treatment—and sequenced them in two separate orders. We included 4 technical replicates for each of the 3 conditions.
| Run/ Order | Condition | Condition Name |
| 1 | Untreated HEK cells (Control) | Control_1 |
| HEK cells treated with IFN-Beta | Beta_1 | |
| HEK cells treated with IFN-Gamma | Gamma_1 | |
| 2 | Untreated HEK cells (Control) | Control_2 |
| HEK cells treated with IFN-Beta | Beta_2 | |
| HEK cells treated with IFN-Gamma | Gamma_2 |
Batch correction eliminates differences between technical replicates
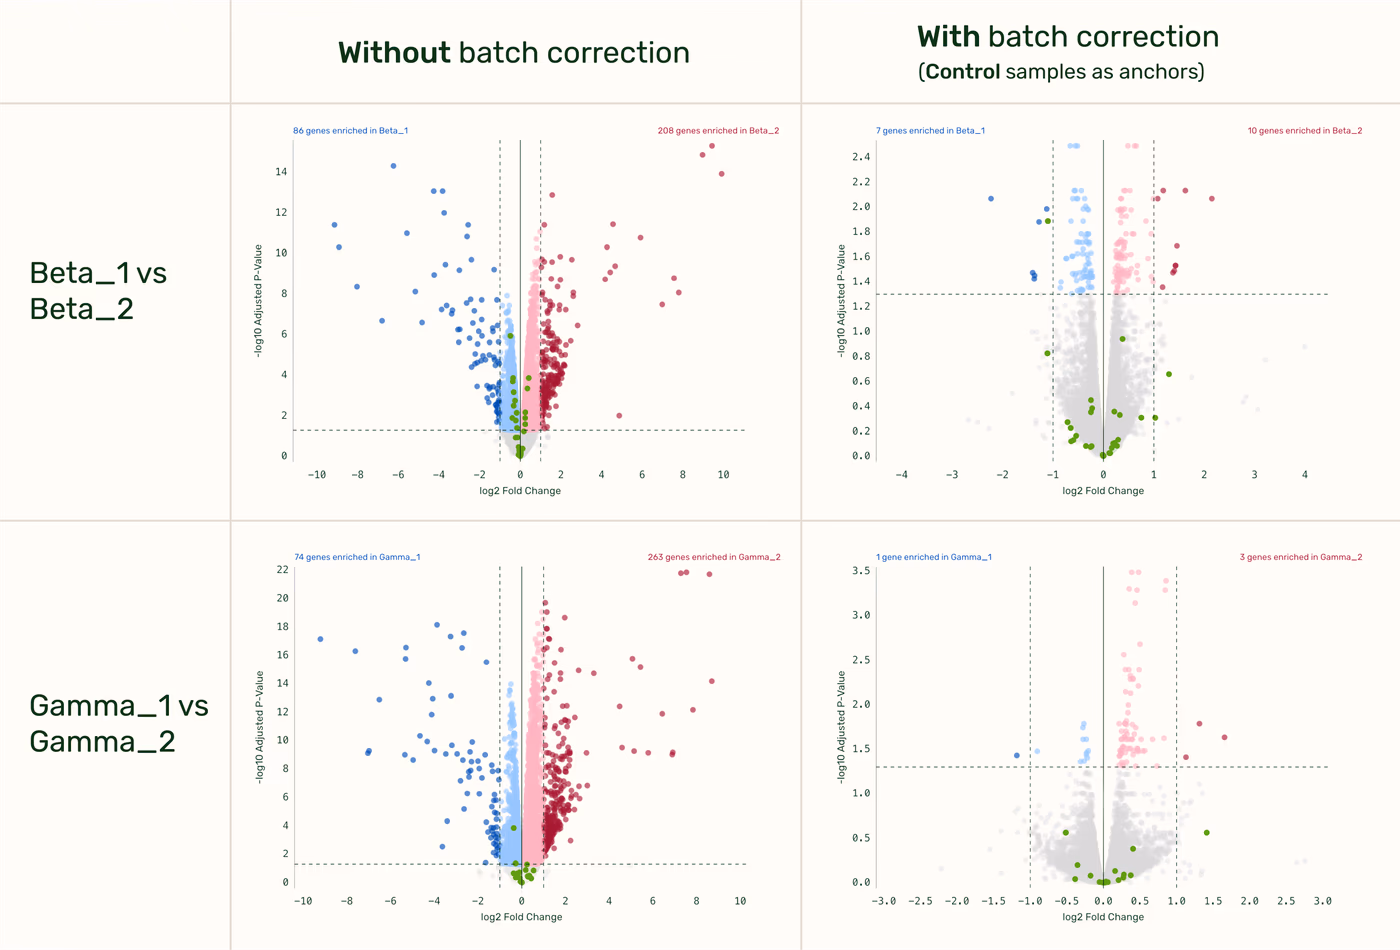
There should be no difference observed between the two technical replicates after batch correction has been applied. Cross order comparison between technical replicates of the same condition (Order 1 vs. Order 2 DGE fold-change) shows no differential expression (beyond the false discovery rate) after batch correction with control samples as anchors.
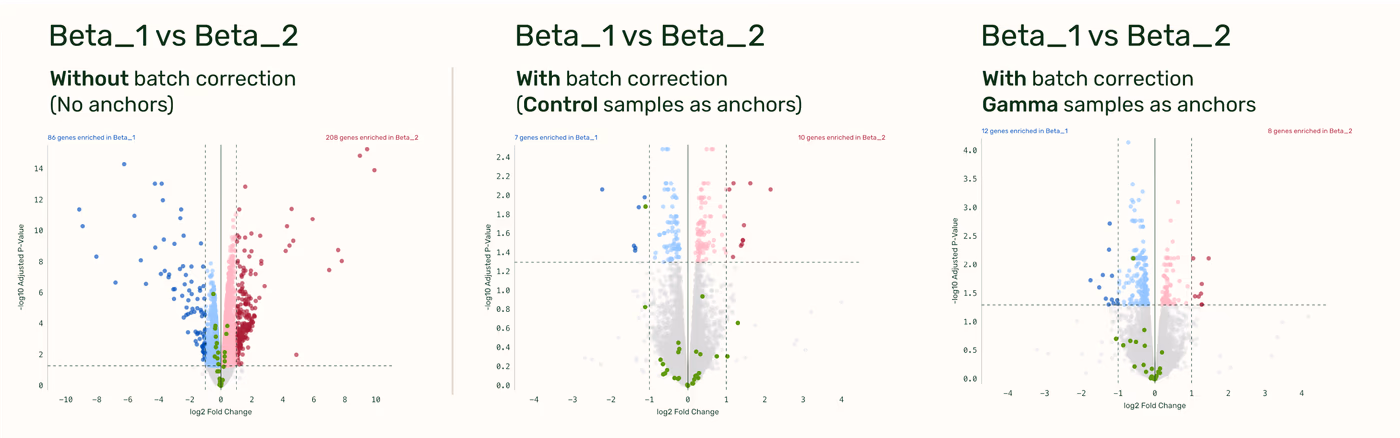
Any anchor with sufficient shared biology produces effective batch correction
As long as your anchor samples share sufficient biology with the sample categories used in the DGE, the specific choice of anchor remains flexible. (”Sufficient biology” means that a DGE comparison between any group in the batch corrected comparison and the anchor category itself would also be meaningful.) For example, a cross-run comparison (Beta_1 vs. Beta_2 fold-change) produces similar results whether you use the Control samples or the Gamma samples as your anchors.
Batch correction recovers gold standard DGE results across runs
To demonstrate the impact of batch correction on a DGE comparison in a more typical experimental workflow, we compared the output of a “gold standard” comparison within the same run (Control_1 vs Beta_1, no batch effects) with the output of a batch corrected cross-run comparison (Control_1 vs. Beta_2). We see that using either the Control samples as anchors or the Gamma samples as anchor yields an output much more similar to the “gold standard” comparison than without any batch correction.
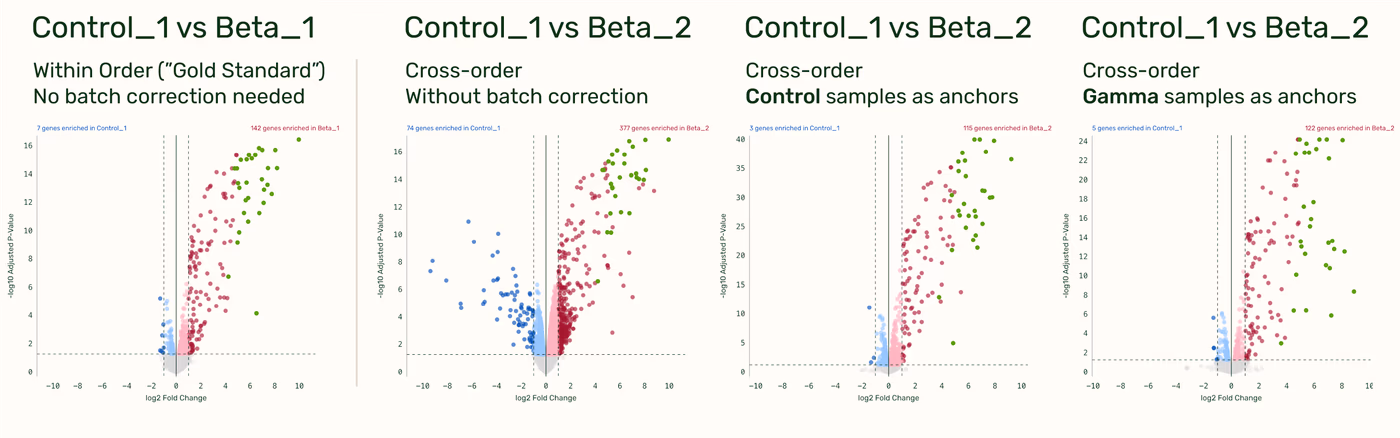
Small note: When given the option, there is a slight improvement in sensitivity if running a DGE with batch correction where one of the comparison groups is the anchor group, compared to if neither comparison groups are the anchor group. E.g. If comparing Control_1 vs Beta_2, using the control samples as anchors will yield more sensitive results than using the gamma samples as anchors. This is an improvement in the DGE output, not of the batch correction. This is because when running a DGE where one of the groups in the comparison is the anchor group, all anchor samples get automatically folded into the DGE. With more samples in a group, the statistical power of the DGE increases.
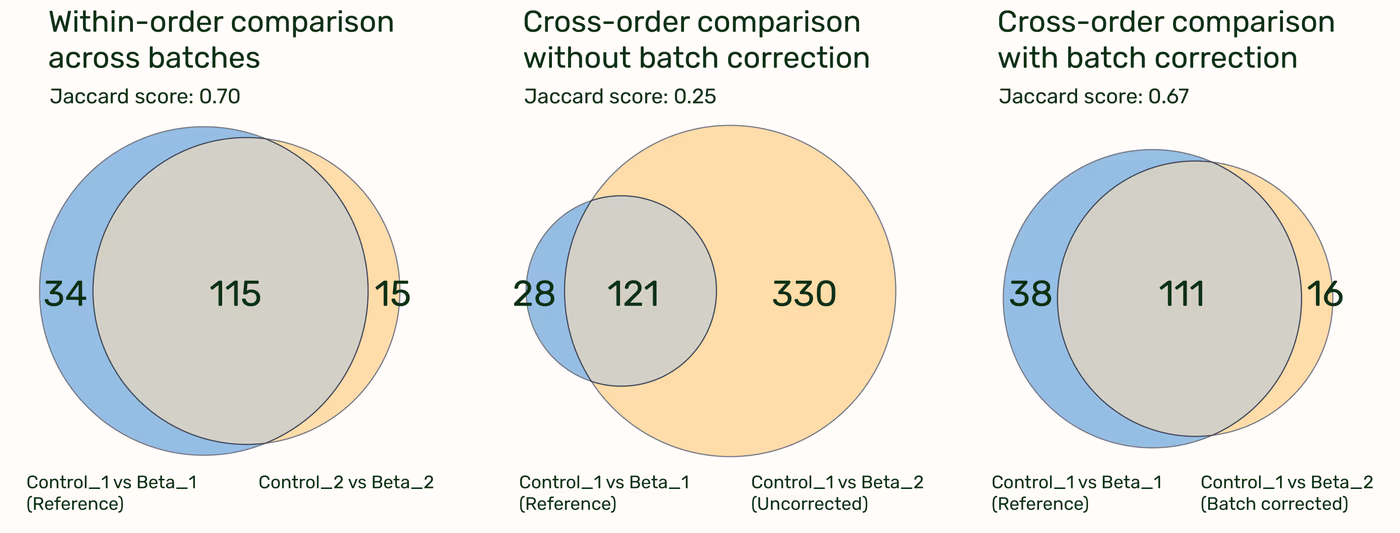
The reproducibility of the genes found to differentially express is easiest visualized with Venn Diagrams. Within-order comparisons between the Control sample and HEK cells treated with IFN-Beta show high agreement with one another. Without batch correction, cross-order comparisons are unreliable, but after correction, they have similar results to the within-order comparisons.
Summary
The most reliable way to compare DGE data is to sequence all of your samples in one run of 96 or fewer samples to avoid batch effects entirely. When you have to split your project into different runs, anchor-based batch correction is the most effective way to keep your data consistent. The Plasmidsaurus batch correction feature is designed to be user-friendly, handling the complex math behind the scenes, to ensure that the patterns you see in your data are a true reflection of your biology, not just a byproduct of when the samples were sequenced.
Data deliverables and file types
Plasmidsaurus has a big team of bioinformaticians who are constantly improving the background analyses that you see in your results page, and their goal is that these detailed interactive visualizations will allow you to jump right into your experiments and start getting insight, without needing to do the data processing yourself.
The following are all available on the Results UI page, or downloadable:
- Interactive volcano plot | Visualize differential gene expression patterns of up- and downregulation.
- Functional enrichment plot | Track the most affected regulatory pathways in your samples (human and mouse only at this time)
- Per-sample expression profiles | Select genes or pathways you want to analyze and see them visualized.
- Gene count tables | Review and download information about differentially expressed genes.
- Enriched pathway tables | Review and download information cellular pathway representation
- Deduplicated .bam file | UMI-deduplicated reads aligned to reference
- Sample correlation matrix | Review pairwise similarity (Pearson’s) between your samples
- Quality control summary | FastQC .html plots showing sequencing summary metrics
- Reads | Raw reads. Please note that these reads are NOT delivered in the default download, but can be downloaded separately by clicking the "Download Raw fastq" button at the top of the "Order Information" page
Troubleshooting
Guarantees and rerun policy
We typically observe 10M or more unique (deduplicated) reads when samples meet our input guidelines. We do not guarantee a specific read count per sample, as this can vary heavily with the number of cells sent, which may occur inadvertently due to user overestimation of RNA levels, or intentionally (e.g. to accommodate culture in small volumes).
If we observe a process deviation (error) in our workflow, we will do our best to rerun your sample and increase the read count. As discussed above, sending additional sample volume, when practical, is a good approach to ensure we can do repeat analyses if necessary.