Genotyping Analysis
Rapidly characterize allelic composition and frequency at a single locus.

Genotype with ease and speed
Accurate characterization of allelic composition and frequency at defined loci is critical, yet traditional workflows remain limited. Sanger sequencing lacks the ability to phase variants, while both Sanger and Illumina are constrained by amplicon length.
Plasmidsaurus redefines the genotyping workflow. We’ve eliminated the bottlenecks: no more PCR cleanup, no more library prep, and no sequencing primers. Whether your amplicons are short or massive, we detect all alleles present at >5% frequency in just 1–2 days. Send your samples today; get your insights tomorrow.
Phase variants: See what Sanger can’t
With Sanger, you see overlapping traces of your variants, like two stop codons, but there isn’t enough information to assign them to alleles.
With Plasmidsaurus, variants are phased and quantified. You can see exactly where each mutation is and whether they’re on the same allele.
Say goodbye to data wrangling
Eliminate complex and tedious analysis pipelines. See visualizations comparing aligned alleles and get sequences and allelic frequencies in 1-2 days.
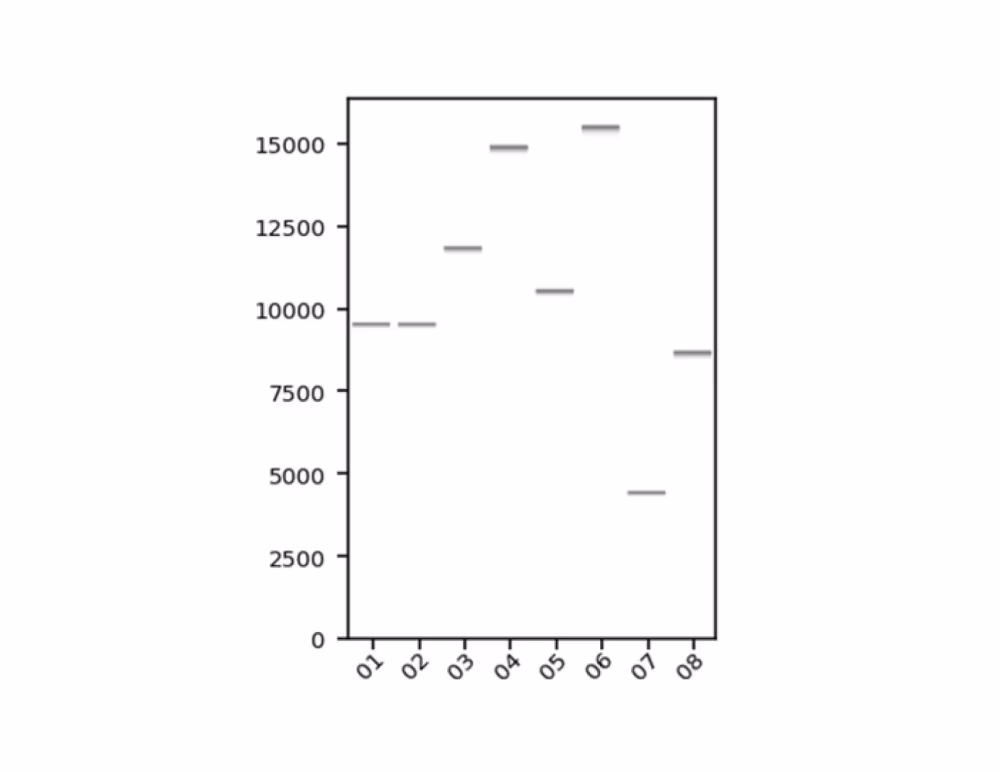
High performance across a range of frequencies and variant types
SNVs and Deletions
Codon Changes and Phased Variants
Key applications
Gene Editing Verification
Screen edited lines for a desired genotype.
Mouse transgenics
Screen founders and progeny for a target allele.
Quality control
Verify genotypes of edited cell lines, model organisms, or incoming germplasm.
Biomarker-based stratification
Group cohorts by variant to analyze and map genotype-phenotype relationships.
Phased variant analysis
Resolve allelic context for improved disease insights
Genetic crosses
Genotype specific loci in hybrids.
Note: Genotyping Analysis is not recommended for highly complex mixtures (e.g. high-diversity libraries) or amplicons with significant variation at a single position (such as samples measuring CRISPR editing efficiency at a locus). For these applications, we recommend using our Premium PCR service to generate reads, which can then be analyzed with your preferred pipeline.
“I've got two distinct indels, so it's a knockout! This tool is awesome! I'm definitely going to recommend this service to friends in my department!”
“Many times our CRISPR-edited mouse founders have multiple variants, and Sanger just can’t deconvolute the linked mutations. This new allele calling pipeline does the work for us. It clearly connects mutations in cis, gives us frequency of alleles, and saves us time digging through noisy raw reads. A huge improvement!”
Data deliverables & bioinformatics
Data tables for allelic sequences

Virtual gel
Allele sequence files

Feature annotations and reference alignments

Sequencing statistics including read length and coverage

Raw reads
"A major pain point with other workflows (e.g. MiSeq) was that library prep alone would take at least 4 hours, and results would take about 10 days to come back. With Plasmidsaurus, I just amplify, do a gel purification, and send it out."
Product specs & service levels
- Long read sequencing with ONT
- Optimized for linear, double-stranded DNA
- Add sample cleanup for $5
| Service Level | Size | Target Read Depth/Sample* | Minimum Volume | Concentration* | Cost | Target Turnaround Time |
|---|---|---|---|---|---|---|
| Standard | 100 bp - 25 kb | Up to 3,000 reads | 10 μL | 1 ng/μL per 100 bp | $30 | 1-2 days |
| Big | 100 bp - 25 kb | Up to 6,000 reads | 20 μL | 1 ng/μL per 100 bp | $60 | 1-2 days |
| Huge | 100 bp - 25 kb | Up to 12,000 reads | 40 μL | 1 ng/μL per 100 bp | $120 | 1-2 days |
* Sequencing is based on the molarity of your DNA insert, therefore the required concentration (ng/uL) will vary depending on your insert size.
Ready to sequence?
Put your DNA in a tube and drop it off. Click below for requirements and suggestion for optimal results.

Related products
Amplicon
Need to verify cloning and gene editing with a specific region? Try Amplicon Sequencing.
AAV
Sequencing AAV? Check out our AAV sequencing service for an ultra-fast service that returns comprehensive data with minimal sample input.
Whole Plasmid
Our Whole Plasmid Sequencing service with ZeroPrep lets you skip culture and minipreps and get straight to your results faster.
FAQs
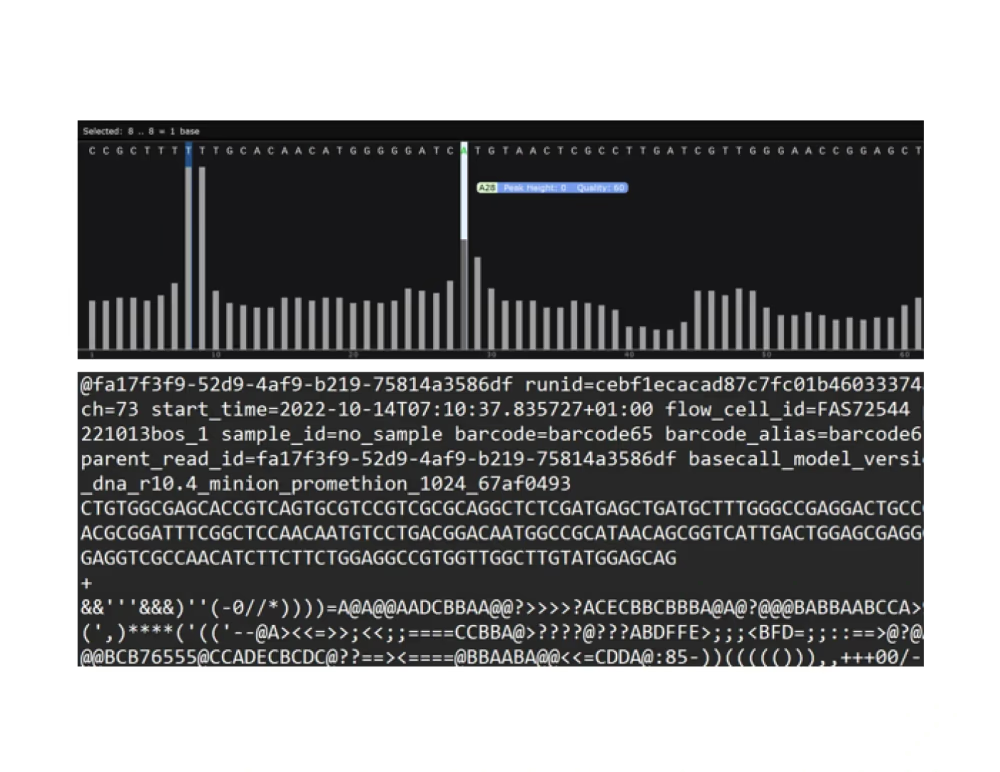
We sequence each sample with Oxford Nanopore long reads to very high depth before generating reads using the latest basecalling and polishing software. Then we cluster these reads into phased alleles.
- We construct an amplification-free long-read sequencing library using the newest v14 library prep chemistry
- We sequence the library with a primer-free protocol using the most accurate R10.4.1 flow cells.
- We remove noise, phase alleles, and report frequencies only for alleles >10%. Frequencies are adjusted so that reported alleles total 100%.
- If we detect a sequence at a frequency below 5%, the tool assumes it is likely due to PCR or sequencing error and assigns those reads to a “major” allele (one that has >5% allele frequency) that is most similar in sequence.
- Example: When a major allele is identified at 48% frequency and a closely related sequence is identified at 2%, the lower-frequency sequence is merged with the major allele. The final reported frequency of the major allele is therefore 50%.
We have tested the genotyping analysis at a range of different allelic ratios for SNPs and small indels. In general we find a strong correlation between experimentally prepared ratios and pipeline-predictions (R2 > .98). If you notice significant discrepancies between our analysis and your expected results, please reach out to us at support@plasmidsaurus.com. To learn more about our data deliverables, see the Genotyping Analysis product page.
If your sample includes alleles that are very dissimilar (<50% sequence identity), the pipeline will categorize the lower frequency sequence(s) as an unassigned read. If there is some homology between a sequence and the dominant, highest frequency allele and our tool cannot confidently align the sequences, alleles will be displayed in separate groups.