Technical Note: Cell line and mouse strain identification in Plasmidsaurus RNA-Seq

Overview
Cell line or strain misidentification can compromise the interpretation and reproducibility of experiments. Plasmidsaurus has developed a genotype-based identification feature using single nucleotide polymorphisms (SNPs) captured directly from RNA-Seq data for human and mouse samples.
Human samples are compared against a reference of 917 cataloged cell lines. Reported outcomes include:
- Cell line identified: The sample is an immortalized cell line, and we report the cataloged line whose SNP genotype is consistent with it.
- Mixture: A second cell line makes up 10% or more of the reads. We name both lines and report the second line's approximate share of reads.
- Not a cell line: The sample is not an immortalized cell line, such as primary cells, tissue, iPSCs, or organoids.
- Unknown: No line in our catalog matches the sample closely enough to name it, or insufficient data is available for classification.
Mouse samples are compared against a separate reference of 53 laboratory and wild-derived strains, reported as 45 strain background groups. Reported outcomes include:
- Strain group identified: We report the strain group, such as C57BL/6 or BALB/c.
- Non-inbred: No single strain fits, as with a cross or an outbred stock.
- Unknown: Insufficient data is available for classification.
This technical note explains how Plasmidsaurus RNA-Seq identifies human cell lines and mouse strain backgrounds, how the methods were built and validated, and how to interpret results.
Introduction
Cell line misidentification is a persistent quality problem in cell-based research. Cross-contamination, mislabeling, and sample mix-ups can result in experiments being performed on a different cell line than intended, undermining the conclusions drawn from them. A 2017 study found that 32,755 articles were published with misidentified cells and in turn were cited by an estimated half a million other papers (Horbach & Halffman, 2017). For this reason, journals, funding agencies, and cell repositories are encouraging or requiring researchers to document how the identity of experimental cell lines has been verified.
In 2023, the International Cell Line Authentication Committee (ICLAC) published the Institutional Best Laboratory Practices for Authentication of Cell Lines and Tissue Samples. ICLAC stated the worldwide average incidence of using misidentified cell lines is 22%. ICLAC recommends scientists employ four methods of authentication of cell lines: verification of cell line identity via their website, genotyping of cell lines, checking for contamination of non-human species, and mycoplasma testing (Korch & Schweppe, 2023).
Cell line identity has traditionally been assessed using dedicated authentication assays. Short tandem repeat (STR) profiling is the established standard for human cell lines, while SNP genotyping and targeted SNP panels have also been used to distinguish cell lines based on their genetic profiles (Fasterius et al., 2017).
RNA-Seq data can provide the same type of genotype information without requiring a separate authentication assay. SNPs captured in expressed transcripts form a genotype fingerprint that can be compared against reference profiles from established cell lines. Previous studies have demonstrated that these RNA-derived genotypes can be used for cell line identification and authentication (Fasterius et al., 2017; Mohammad et al., 2019). This provides a basis for incorporating cell line identification directly into an RNA-Seq analysis workflow.
Cell line identification in Plasmidsaurus RNA-Seq
How cell line identification works
Cell line identification is performed automatically as part of the standard Plasmidsaurus RNA-Seq analysis pipeline. SNPs captured in the same RNA-Seq reads used for transcriptomic analysis provide a genotype fingerprint for each sample, so no separate genotyping assay or additional sequencing data are required.
Human cell line and mouse strain identification use the same overall genotype-based analysis workflow, but with species-specific SNP panels, reference datasets, and classification models. For clarity, we describe the human cell line analysis first, including the shared genotyping and classification steps, and then describe the mouse-specific reference and reporting differences separately.
For each sample, the analysis proceeds through two main steps: genotyping SNPs from the RNA-Seq reads and classifying the resulting genotype against the reference set. Human samples are also evaluated for evidence of a second cell line.
Genotyping: For each sample, reads are aligned and variant-called at panel sites. Samples without enough covered panel sites are not classified.
Classification: Each sample's genotype is scored against every reference line using a probabilistic model that accounts for sequencing depth at each site. A line is named only when it fits clearly better than both alternative reference lines and a model of genotypes absent from the reference.
Classification performance depends on the number of informative SNP sites covered in each sample, which is influenced by sequencing depth and expression breadth. Samples with low coverage or limited transcript complexity may not contain enough information to support a cell line call.
Human samples are evaluated using a panel of 235 informative SNPs and compared against a reference collection of 917 cataloged cell lines. The reference consists of a measured set of 39 cell lines characterized from internal Plasmidsaurus RNA-Seq data and an extended set of 878 additional cell lines derived from CCLE (CCLE; Ghandi et al., 2019).
Mixture detection (human only): Mixtures are assessed from the distribution of variant-allele fractions across expressed SNPs, followed by a genotype-based test that identifies the second line and estimates its share of reads.
- Samples whose genotype departs slightly from their line's profile but is not explained by any specific second line, as is typical of engineered derivatives, are identified as their parental line and not reported as mixtures.
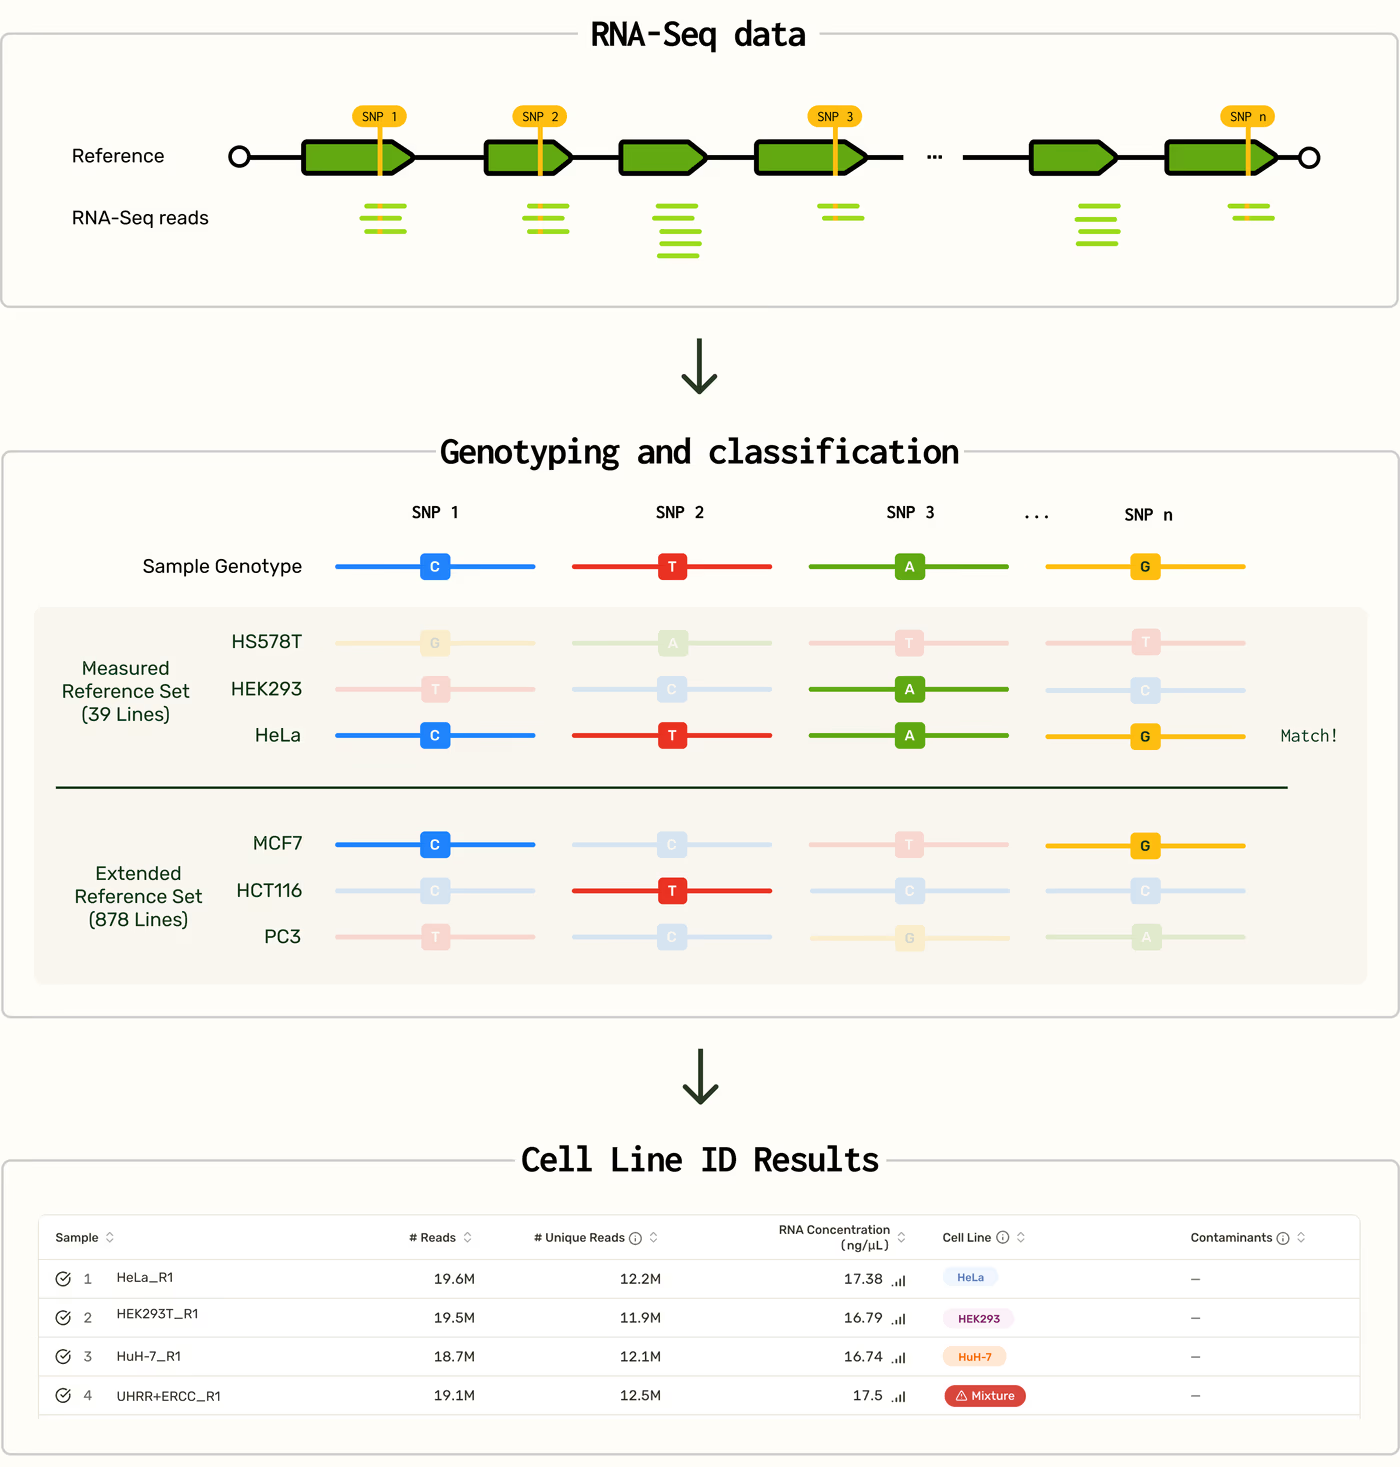
Interpreting human cell ID results
Each sample’s results appear in the Sample Review table on the Results page for the order. A sample receives one of the following results:
Cell line identified
Measured reference line: The named line is one of the 39 measured lines. For example, "The SNP signature of this sample is consistent with HEK293." This is the strongest result, backed by an assay-matched internal reference and cross-validated performance.
Extended reference line: The named line is one of the 878 extended lines, whose reference genotype is inferred from public CCLE data only rather than from our own sample sets. For example, "The SNP signature of this sample is consistent with HuH-7."
Unknown
No line in our catalog matches the sample closely enough to name it, or too few sites were covered. An unknown result should not be interpreted as evidence of misidentification. This is expected for samples that are not represented by the reference, as well as samples with insufficient informative coverage.
Mixture
A mixture flag means the sample appears to contain a second cell line, for example from cross-contamination or a sample mix-up. Mixtures are reported when both the major and the second line are among the 39 measured lines and the second line accounts for at least 10% of the sample's reads. We report both lines, including an estimated read share of the second line with a 90% confidence range. The share is a fraction of RNA reads, not of cells: two lines can produce different amounts of RNA per cell, so a read share only approximates the cellular composition.
Second genomes below 10% of reads are not reported. Mixtures involving extended (CCLE) lines are not reported. Mixture assessment requires at least 2 million unique mapped reads.
Not a cell line
- The sample does not look like an immortalized cell line. This is expected for samples such as primary cells, extracted tissue, iPSC or organoid material.
- The sample does not look like an immortalized cell line. This is expected for samples such as primary cells, extracted tissue, iPSC or organoid material.
Some reference cell lines were derived from the same individual, such as MCF7 and KPL-1, or AU565 and SK-BR-3, and cannot be told apart by genotype. When a sample matches one of these lines, the related lines are reported alongside the call rather than one being chosen arbitrarily.
Cell lines that have been engineered (for example knockouts, knock-ins, or stable transfectants) or have drifted during long-term culture can differ slightly from the reference profile of their parental line. These samples are identified as their parental line and are not reported as mixtures.
Bioinformatics methods
Human SNP panel selection
Because Plasmidsaurus RNA-Seq reads are concentrated in 3′ untranslated regions (3′UTRs) and terminal exons, the cell line identification panel was designed around SNPs that are reliably captured in these regions. The panel consists of 235 common SNPs selected for reliable detection and for sufficient polymorphism to distinguish among reference cell lines.
Human reference construction
Two reference sets were constructed for human cell line identification: a measured reference set derived directly from Plasmidsaurus RNA-Seq data and an extended reference set derived from public CCLE genotypes.
The measured reference set comprises 39 cell lines with sufficient representation in internal Plasmidsaurus RNA-Seq data to estimate robust reference genotypes across the SNP panel. Reference genotypes for these lines are derived from thousands of internal samples, providing assay-matched genotype profiles for the Plasmidsaurus 3′ RNA-Seq workflow.
Measured reference cell lines:
| Tissue Source | Measured Lines |
|---|---|
| Blood / leukemia | HL-60, Jurkat, K562, MOLM-13, MV4-11, OCI-AML2, OCI-AML3, THP-1 |
| Breast | Hs578T, MCF10A, MCF7, T-47D |
| Colorectal | DLD-1, HCT116, HT-29, LS1034 |
| Lung | A549, NCI-H1299, NCI-H1975, NCI-H460 |
| CNS / neural | SH-SY5Y, SK-N-BE(2), U-87 MG, U251 |
| Pancreas | AsPC-1, PANC-1, SUIT-2 |
| Liver / biliary | Hep3B, HepG2, HuCCT1 |
| Kidney | 786-O, HEK293 |
| Prostate | 22Rv1, LNCaP |
| Bone / soft tissue | RH30, U-2 OS |
| Cervix | HeLa |
| Skin | A375 |
| Retina | RPE1 |
The extended reference set adds 878 cell lines from the Cancer Cell Line Encyclopedia (CCLE). For these lines, public CCLE genotypes are combined with site-specific detectability in 3′ end counting RNA-Seq, calibrated using the measured reference set.
A complete list of reference cell lines is available for download:
Plasmidsaurus RNA-Seq Cell Line ID Reference List
Human model development and validation
We developed the cell line classifier using approximately 9,000 Plasmidsaurus RNA-Seq samples with known cell line identities across 39 commonly used lines, along with the CCLE RNA-Seq data. The model estimates two components from these data: a reference genotype profile for each cell line, defined by the expected allele fraction at each SNP in the panel, and reporting thresholds that determine when the evidence for a match is strong enough to make a call.
The reference profiles were developed and evaluated using leave-one-out cross-validation. For each sample, classification was performed using profiles estimated without any samples from that sample’s culture, providing a test of whether the learned genotype profiles generalize across independent cultures of the same cell line. Reporting thresholds were calibrated separately using 10-fold cross-validation to determine how much evidence is required for the best-matching line to be reported rather than leaving the sample unclassified.
Across these cross-validation analyses, 97% of samples received a cell line call, and 99.5% of those calls were correct. Most samples that did not receive a call had insufficient coverage of the SNP panel to support a classification.
Cell lines outside the reference: We evaluated the classifier’s open-set performance using 504 samples from cell lines that were not represented in the reference. This test measures whether the classifier can recognize when a sample does not match any known reference line rather than forcing an incorrect assignment. All 504 samples were correctly classified as “Unknown.”
Extended reference lines: The reference profiles for the 878 extended lines were derived from public CCLE genotypes rather than from Plasmidsaurus RNA-Seq data, so we evaluated their performance separately. Using a held-out set of 295 samples from known CCLE cell lines, 84% of samples received a cell line call, and 98.4% of those calls were correct.
Mixture detection: The results of the cell line classifier model are used to evaluate whether more than one SNP profile is identified in a sample. We evaluated mixture detection using both experimentally designed samples and simulated mixtures.
Designed samples: We tested approximately 150 samples containing two or more cell lines, alongside 720 samples containing a single cell line. All multi-line samples were identified as mixtures while no single-line samples were misclassified.
- Simulated mixtures: We simulated mixtures for all pairs of the 39 measured cell lines, with the second line contributing 2% to 50% of reads. At 5% of reads and above, the second line was always detected and correctly identified. For mixtures in which the second line contributed up to 20% of reads, the reported confidence range contained the true read share in 97–99% of cases. For more evenly mixed samples, the reported range tended to underestimate the second line’s contribution: it contained the true share in 85% of mixtures at 30% and 66% of mixtures at 50%.
Mouse strain identification
Mouse RNA samples are analyzed using a similar genotype-based approach applied to a separate mouse SNP panel of 600 sites. Sites were selected from the Mouse Genomes Project (Keane et al., 2011), restricted to those reliably genotyped by the Plasmidsaurus 3′ RNA-Seq assay and selected to distinguish the represented strain groups.
The reference contains 53 strains, reported as 45 strain background groups. Strains that cannot be distinguished at the panel sites are reported together as a single group:
| Group reported | Strains included |
|---|---|
| C57BL/6 | C57BL/6J, C57BL/6NJ, C57BL/10J, C57BL/10SnJ |
| 129 | 129P2/OlaHsd, 129S1/SvImJ, 129S5/SvEvBrd |
| BALB/c | BALB/cJ, BALB/cByJ |
| C3H/He | C3H/HeJ, C3H/HeH |
| C57L/C57BR | C57L/J, C57BR/cdJ |
The remaining 40 groups are single strains: 31 classical laboratory strains (A/J, AKR/J, B10.RIII, BTBR T+ Itpr3tf/J, BUB/BnJ, C58/J, CBA/J, CE/J, DBA/1J, DBA/2J, FVB/NJ, I/LnJ, KK/HiJ, LG/J, LP/J, MAMy/J, NOD/ShiLtJ, NON/LtJ, NZB/BlNJ, NZO/HlLtJ, NZW/LacJ, PL/J, QSi3, QSi5, RF/J, RIIIS/J, SEA/GnJ, SJL/J, SM/J, ST/bJ, SWR/J) and 9 wild-derived strains (CAST/EiJ, CZECHII/EiJ, JF1/MsJ, LEWES/EiJ, MOLF/EiJ, PWK/PhJ, SPRET/EiJ, WSB/EiJ, ZALENDE/EiJ).
Each sample receives one of three outcomes:
Inbred: A single strain background explains the genotype and is named at the group level. Substrains within a group are not distinguished.
Non-inbred: No single strain background fits. This is the expected result for, for example, F1 hybrids, segregating crosses, outbred stocks, and backgrounds not represented in the reference, which cannot be distinguished from one another. The nearest background may be shown for context.
- Unknown: Too few informative sites were covered to judge.
The mouse model uses an SNP classifier similar to the human cell line model’s, but its reference genotypes come from the Mouse Genomes Project rather than from Plasmidsaurus samples. We evaluated the model using 5-fold cross-validation on 3,513 mouse RNA-seq samples with known strain backgrounds, covering 15 of the 45 background groups. Of those, 98.2% of samples were correctly named, and all 12 F1 hybrid samples (C57BL/6 × PWK), were correctly reported as non-inbred.
References
Fasterius, E. et al. A novel RNA sequencing data analysis method for cell line authentication. PLoS ONE 12: e0171435 (2017). doi: 10.1371/journal.pone.0171435
Ghandi, M. et al. Next-generation characterization of the Cancer Cell Line Encyclopedia. Nature 569: 503–508 (2019). doi: 10.1038/s41586-019-1186-3
Horbach, S.P.J.M. & Halffman, W. The ghosts of HeLa: how cell line misidentification contaminates the scientific literature. PLoS ONE 12: e0186281 (2017). doi: 10.1371/journal.pone.0186281
Keane, T.M. et al. Mouse genomic variation and its effect on phenotypes and gene regulation. Nature 477: 289–294 (2011). doi: 10.1038/nature10413
Korch, C.T. & Schweppe, R.E. Institutional best laboratory practices for cell line and tissue sample authentication to ensure valid, reproducible and robust research. International Cell Line Authentication Committee (2023). https://iclac.org/wp-content/uploads/ICLAC-Institutional-Best-Lab-Practices-Cell-Line-Authentication_COMBO-2023.pdf
Mohammad, T.A. et al. CeL-ID: cell line identification using RNA-seq data. BMC Genomics 20 (Suppl 1): 81 (2019). doi: 10.1186/s12864-018-5371-9
PS-0013-E | v1.0 | Revised Sep. 30, 2026